-
Posted on
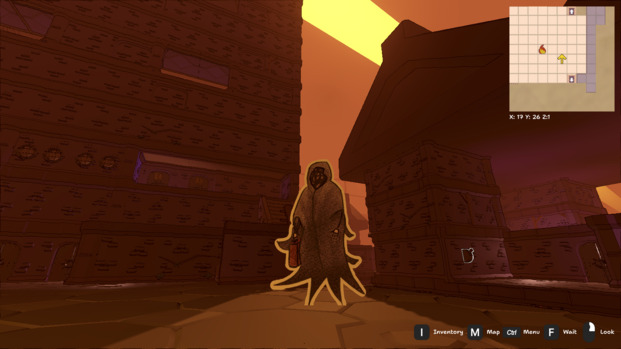
Thoughts on releasing our first indie game
Two weeks ago we released Dice’n Goblins, our first game on Steam. This project allowed me to discover and learn a lot of new things about game development and the industry. I will use this blog post to write down what I consider to be the most important lessons from the months spent working on this.
The development started around 2 years ago when Daphnée started prototyping a dungeon crawler featuring a goblin protagonist. After a few iterations, the game combat started featuring dice, and then those dice could be used to make combos.
In May 2024, the game was baptized Dice’n Goblins, and a Steam page was created featuring some early gameplay screenshots and footage. I joined the project full-time around this period.
Almost one year later, after amassing more than 8000 wishlists, the game finally released on Steam on April 4th, 2025. It was received positively by the gaming press, with great reviews from PCGamer and LadiesGamers. It now sits at 92% positive reviews from players on Steam.
Building RPGs isn’t easy
As you can see from the above timeline, building this game took almost two years and two programmers. This is actually not that long if you consider that other indie RPGs have taken more than 6 years to come out.
The main issue with the genre is that you need to create a believable world. In practice, this requires programming many different systems that will interact together to give the impression of a cohesive universe. Every time you add a new system, you need to think about how it will fit all the existing game features.
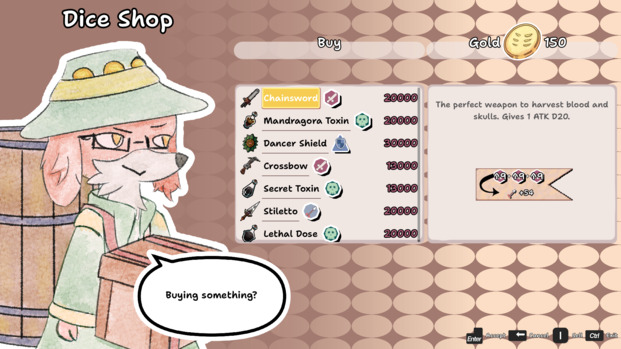
For example, players typically expect an RPG to have a shop system. Of course, this means designing a shop non-player character (or building) and creating a UI that is displayed when you interact with it. But this also means thinking through a lot of other systems: combat needs to be changed to reward the player with gold, every item needs a price tag, chests should sometimes reward the player with gold, etc…
Adding too many systems can quickly get into scope creep territory, and make the development exponentially longer. But you can only get away with removing so much until your game stops being an RPG. Making a game without a shop might be acceptable, but the experience still needs to have more features than “walking around and fighting monsters” to feel complete.
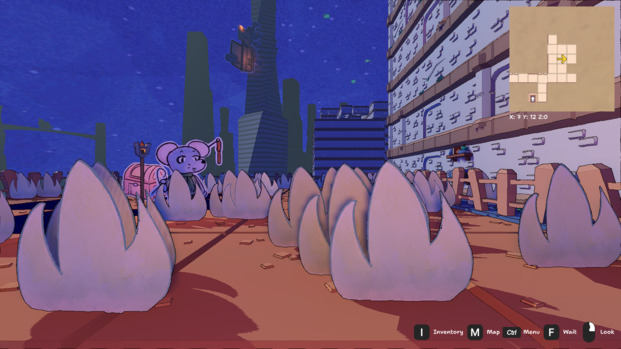
RPGs are also, by definition, narrative experiences. While some games have managed to get away with procedurally generating 90% of the content, in general, you’ll need to get your hands dirty, write a story, and design a bunch of maps. Creating enough content for a game to fit 12h+ without having the player go through repetitive grind will by itself take a lot of time.
Having said all that, I definitely wouldn’t do any other kind of games than RPGs, because this is what I enjoy playing. I don’t think I would be able to nail what makes other genres fun if I don’t play them enough to understand what separates the good from the mediocre.
Marketing isn’t that complicated
Everyone in the game dev community knows that there are a lot of games releasing on Steam. To stand out amongst the 50+ games coming out every day, it’s important not only to have a finished product but also to plan a marketing campaign well in advance.
For most people coming from a software engineering background, like me, this can feel extremely daunting. Our education and jobs do not prepare us well for this kind of task.
In practice, it’s not that complicated. If your brain is able to provision a Kubernetes cluster, then you are most definitely capable of running a marketing campaign.
Like anything else, it’s a skill that you can learn over time by practicing it, and iteratively improving your methods. During the 8 months following the Steam page release, we tried basically everything you can think of as a way to promote the game. Every time something was having a positive impact, we would do it more, and we quickly stopped things with low impact.
The most important thing to keep in mind is your target audience. If you know who wants the game of games you’re making, it is very easy to find where they hang out and talk to them.
This is however not an easy question to answer for every game. For a long while, we were not sure who would like Dice’n Goblins. Is it people who like Etrian Odyssey? Fans of Dicey Dungeons? Nostalgic players of Paper Mario? For us, the answer was mostly #1, with a bit of #3.
Once we figured out what was our target audience, how to communicate with them, and most importantly, had a game that was visually appealing enough, marketing became very straightforward. This is why we really struggled to get our first 1000 wishlists, but getting the last 5000 was actually not that complicated.
Publishers aren’t magic
At some point, balancing the workload of actually building the game and figuring out how to market it felt too much for a two-person team. We therefore did what many indie studios do, and decided to work with a publisher. We worked with Rogue Duck Interactive, who previously published Dice & Fold, a fairly successful dice roguelike.
Without getting too much into details, it didn’t work out as planned and we decided, by mutual agreement, to go back to self-publishing Dice’n Goblins. The issue simply came from the audience question mentioned earlier. Even though Dice & Fold and Dice’n Goblins share some similarities, they target a different audience, which requires a completely different approach to marketing.
The lesson learned is that when picking a publisher, the most important thing you can do is to check that their current game catalog really matches the idea you have of your own game. If you’re building a fast-paced FPS, a publisher that only has experience with cozy simulation games will not be able to help you efficiently. In our situation, a publisher with experience in roguelikes and casual strategy games wasn’t a good fit for an RPG.
In addition to that, I don’t think the idea of using a publisher to remove marketing toil and focus on making the game is that much of a good idea in the long term. While it definitely helps to remove the pressure from handling social media accounts and ad campaigns, new effort will be required in communicating and negotiating with the publishing team. In the end, the difference between the work saved and the work gained might not have been worth selling a chunk of your game.
Conclusion
After all this was said and done, one big question I haven’t answered is: would I do it again? The answer is definitely yes.
Not only building this game was an extremely satisfying endeavor, but so much has been learned and built while doing it, it would be a shame not to go ahead and do a second one.
-
Posted on
Writing GDScript with Neovim
Neovim is by far my favorite text editor. The clutter-free interface and keyboard-only navigation are what keep me productive in my daily programming. In an earlier post, I explained how I configure it into a minimalist development environment. Today, I will show you how to use it with Godot and GDScript.
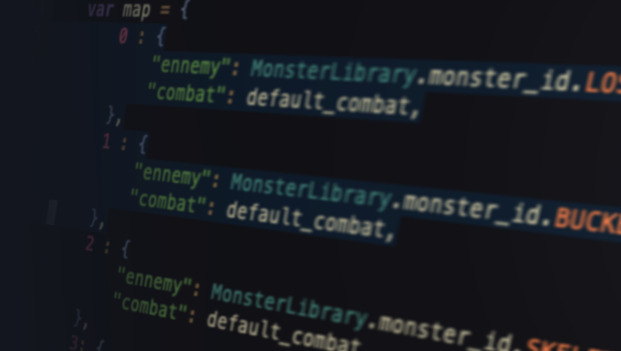
Configure Godot
First, we need to tell Godot to use nvim as a text editor instead of the built-in one. Open Godot, and head to
Editor Settings > General > Text Editor > External. There, you will need to tick the boxUse external editor, indicate your Neovim installation path, and use--server /tmp/godothost --remote-send "<C-\><C-N>:n {file}<CR>{line}G{col}|"as execution flags.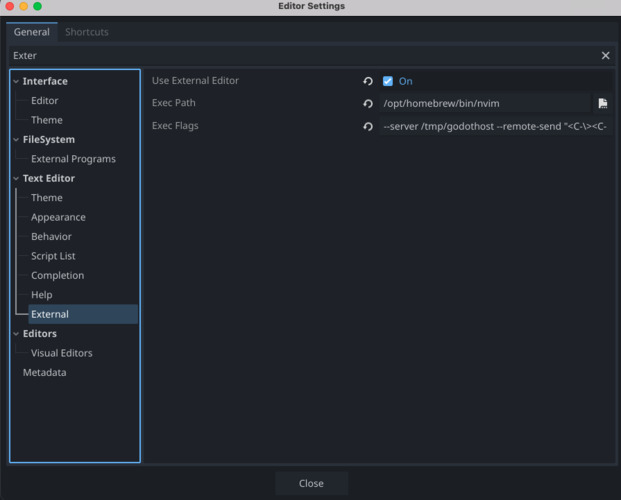
While in the settings, head to
Network > Language Serverand note down the remote port Godot is using. By default, it should be 6005. We will need that value later.Connecting to Godot with vim-godot
Neovim will be able to access Godot features by using a plugin called vim-godot. We will need to edit the nvim configuration file to install plugins and configure Neovim. On Mac and Linux, it is located at
~/.config/nvim/init.vimI use vim-plug to manage my plugins, so I can just add it to my configuration like this:
call plug#begin('~/.vim/plugged')
" ...
Plug 'habamax/vim-godot'
" ...
call plug#end()
Once the configuration file is modified and saved, use the
:PlugInstallcommand to install it.You’ll also need to indicate Godot’s executable path. Add this line to your init.vim:
let g:godot_executable = '/Applications/Godot.app/Contents/MacOS/Godot'For vim-godot to communicate with the Godot editor, it will need to listen to the
/tmp/godothostfile we configured in the editor previously. To do that, simply launch nvim with the flag--listen /tmp/godothost.To save you some precious keypress, I suggest creating a new alias in your bashrc/zshrc like this:
alias gvim="nvim --listen /tmp/godothost"Getting autocompletion with coc.nvim
Godot ships with a language server. It means the Godot editor can provide autocompletion, syntax highlighting, and advanced navigation to external editors like nvim.
While Neovim now has built-in support for the language server protocol, I’ve used the plugin
coc.nvimto obtain these functionalities for years and see no reason to change. You can also install it with vim-plug by adding the following line to your plugin list:Plug 'neoclide/coc.nvim', {'branch':'release'}Run
:PlugInstallagain to install it.You’ll need to indicate the Godot language server address and port using the command
:CocConfig. It should open Coc’s configuration file, which is a JSON file normally located at~/.config/nvim/coc-settings.json. In this file enter the following data, and make sure the port number matches the one located in your editor:{ "languageserver": { "godot": { "host": "127.0.0.1", "filetypes": ["gdscript"], "port": 6005 } } }I recommend adding Coc’s example configuration to your init.vim file. You can find it on GitHub. It will provide you with a lot of useful shortcuts, such as using
gdto go to a function definition andgrto list its references.Debugging using nvim-dap
If you want to use the debugger from inside Neovim, you’ll need to install another plugin called nvim-dap. Add the following to your plugins list:
Plug 'mfussenegger/nvim-dap'The plugin authors suggest configuring it using Lua, so let’s do that by adding the following in your init.vim:
lua <<EOF
local dap = require("dap")
dap.adapters.godot = {
	type = "server",
	host = "127.0.0.1",
	port = 6006,
}

dap.configurations.gdscript = {
	{
		type = "godot",
		request = "launch",
		name = "Launch scene",
		project = "${workspaceFolder}",
		launch_scene = true,
	},
}

vim.api.nvim_create_user_command("Breakpoint", "lua require'dap'.toggle_breakpoint()", {})
vim.api.nvim_create_user_command("Continue", "lua require'dap'.continue()", {})
vim.api.nvim_create_user_command("StepOver", "lua require'dap'.step_over()", {})
vim.api.nvim_create_user_command("StepInto", "lua require'dap'.step_into()", {})
vim.api.nvim_create_user_command("REPL", "lua require'dap'.repl.open()", {})
EOF
This will connect to the language server (here on port 6005), and allow you to pilot the debugger using the following commands:
:Breakpointto create (or remove) a breakpoint:Continueto launch the game or run until the next breakpoint:StepOverto step over a line:StepIntoto step inside a function definition:REPLto launch a REPL (useful if you want to examine values)
Conclusion
I hope you’ll have a great time developing Godot games with Neovim. If it helps you, you can check out my entire init.vim file on GitHub gist.
-
Posted on
Stuff I've been working on
It’s been around 2 years that I’ve had to stop with my long-term addiction to stable jobs. Quite a few people who read this blog are wondering what the hell exactly I’ve been doing since then so I’m going to update all of you on the various projects I’ve been working on.
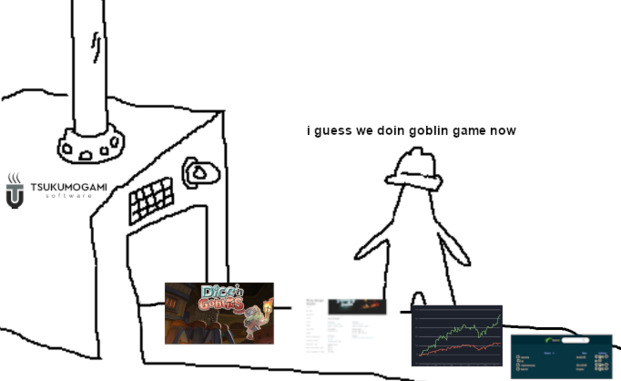
Meme credit: Fabian Stadler Mikochi
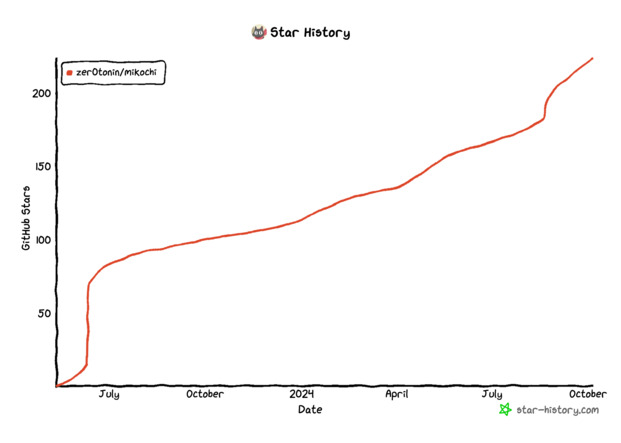
Last year, I created Mikochi, a minimalist remote file browser written in Go and Preact. It has slowly been getting more and more users, and it’s now sitting at more than 200 GitHub stars and more than 6000 Docker pulls.
I personally use it almost every day and it fits my use case perfectly. It is basically feature-complete so I don’t do too much development on it.
I’ve actually been hoping users help me solve the few remaining GitHub issues. So far it happened twice, a good start I guess.
Itako
You may have seen a couple of posts on this blog regarding finance. It’s a subject I’ve been trying to learn more about for a while now. This led me to read some excellent books including Nassim Taleb’s Fooled by Randomness, Robert Shiller’s Irrational Exuberance, and Robert Carver’s Smart Portfolios.

Those books have pushed me toward a more systematic approach to investing, and I’ve built Itako to help me with that. I’ve not talked about it on this blog so far, but it’s a SaaS software that gives clear data visualizations of a stock portfolio performance, volatility, and diversification.
It’s currently in beta and usable for free. I’m quite happy that there are actually people using it and that it seems to work without any major issues. However, I think making it easier to use and adding a couple more features would be necessary to make it into a commercially viable product.
I try to work on it when I find the time, but for the next couple of months, I have to prioritize the next project.
Dice’n Goblins
I play RPGs too much and now I’m even working on making them. This project was actually not started by me but by Daphnée Portheault. In the past, we worked on a couple of game jams and produced Cosmic Delusion and Duat. Now we’re trying to make a real commercial game called Dice’n Goblins.
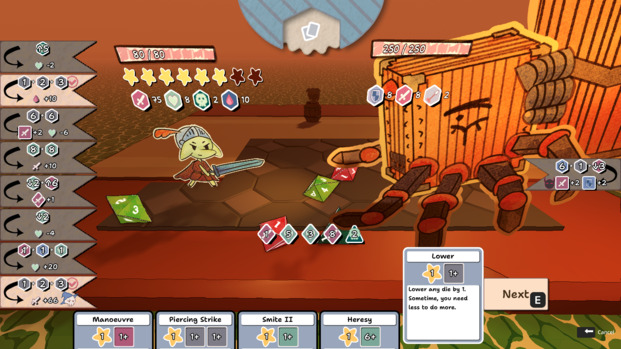
The game is about a Goblin who tries to escape from a dungeon that seems to grow endlessly. It’s inspired by classic dungeon crawlers like Etrian Odyssey and Lands of Lore. The twist is that you have to use dice to fight monsters. Equipping items you find in the dungeon gives you new dice and using skills allows you to change the dice values during combat (and make combos).
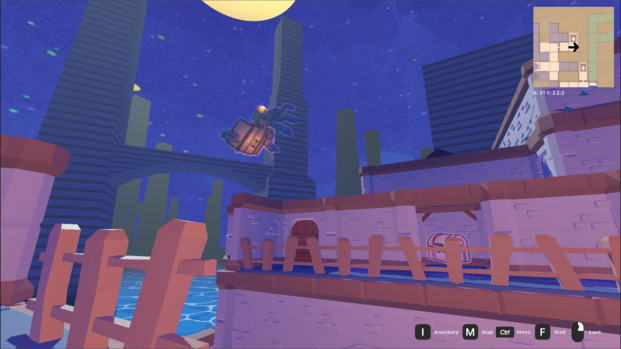
We managed to obtain a decent amount of traction on this project and now it’s being published by Rogue Duck Interactive. The full game should come out in Q1 2025, for PC, Mac, and Linux. You can already play the demo (and wishlist the game) on Steam. If you’re really enthusiastic about it, don’t hesitate to join the Discord community.
Technically it’s quite a big change for me to work on game dev since I can’t use that many of the reflexes I’ve built while working on infra subjects. But I’m getting more and more comfortable with using Godot and figuring out all the new game development related lingo. It’s also been an occasion to do a bit of work with non-code topics, like press relations.
Japanese
Something totally not relevant to tech. Since I’ve managed to reach a ‘goed genoeg’ level of Dutch, I’ve also started to learn more Japanese. I’ve almost reached the N4 level. (By almost I mean I’ve failed but it was close.)
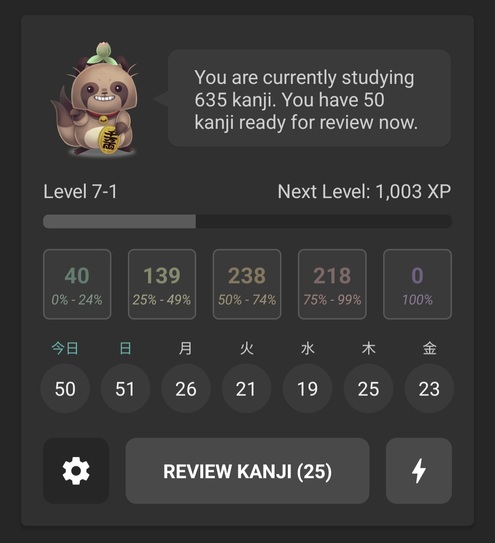
A screenshot from the Kanji Study Android App I’ve managed to learn all the hiraganas, katakanas, basic vocabulary, and grammar. So now all I’ve left to do is a huge amount of immersion and grind more kanjis. This is tougher than I thought it would be but I guess it’s fun that I can pretend to be studying while playing Dragon Quest XI in Japanese.
-
Posted on
How to publish your Godot game on Mac
Since 2019, Apple has required all MacOS software to be signed and notarized. This is meant to prevent naive users from installing malware while running software from unknown sources. Since this process is convoluted, it stops many indie game developers from releasing their Godot games on Mac. To solve this, this article will attempt to document each and every step of the signing and notarization process.

Photo by Natasya Chen Step 0: Get a Mac
While there tools exists to codesign/notarize Mac executables from other platforms, I think having access to a MacOS machine will remove quite a few headaches.
A Mac VM, or even a cloud machine, might do the job. I have not personally tested those alternatives, so if you do, please tell me if it works well.
Step 1: Get an Apple ID and the Developer App
You can create an Apple ID through Apple’s website. While the process should be straightforward, it seems like Apple has trust issues when it comes to email from protonmail.com or custom domains. Do not hesitate to contact support in case you encounter issues creating or logging into your Apple ID. They are quite responsive.
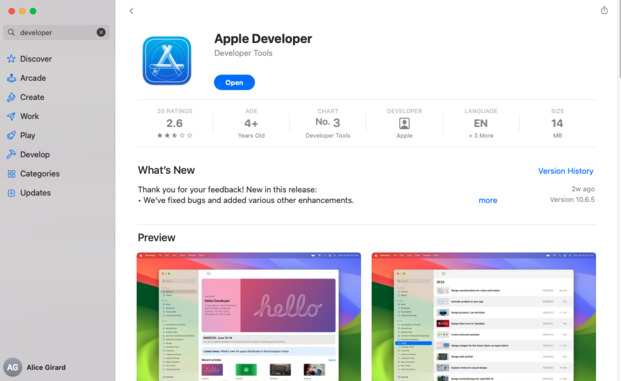
Once you have a working Apple ID, use it to log into the App Store on your Mac and install the Apple Developer application.
Step 2: Enroll in the Apple Developer Program
Next, open the Apple Developer app, log in, and ask to “Enroll” in the developer program.
This will require you to scan your ID, fill in data about you and your company, and most likely confirm those data with a support agent by phone. The process costs ~99$ and should take between 24 and 48 hours.
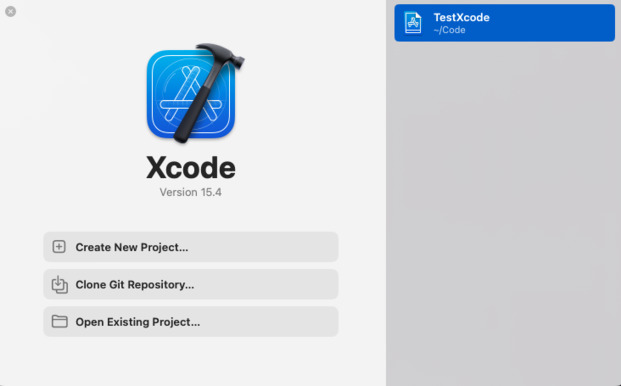
Step 3: Setup Xcode
Xcode will be used to codesign and notarize your app through Godot. You should install the app through the App Store like you did for the Apple Developer application.
Once the app is installed, we need to accept the license.
First, launch Xcode and close it. Then open a terminal and run the following commands:
sudo xcode-select -s /Applications/Xcode.app/Contents/Developer
sudo xcodebuild -license accept
Step 4: Generate a certificate signing request
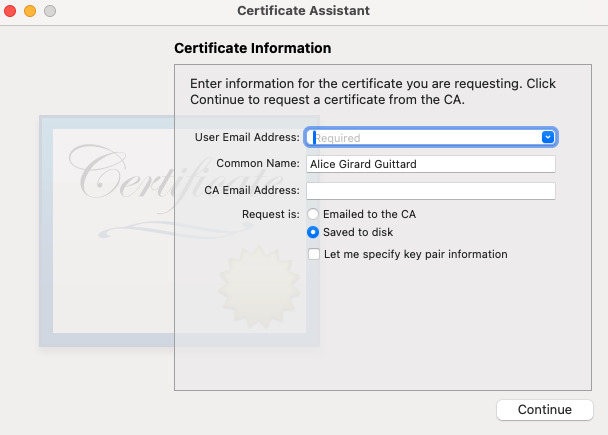
To obtain a code signing certificate, we need to generate a certificate request.
To do this, open Keychain, and from the top menu, select Keychain Access > Certificate Assistant > Request a Certificate From a Certificate Authority. Fill in your email address and choose Request is: Saved to disk. Click on Continue and save the .certSigningRequest file somewhere.
Step 5: Obtain a code signing certificate
Now, head to the Apple Developer website. Log in and go to the certificate list. Click on the + button to create a new certificate. Check Developer ID Application when asked for the type of certificate and click on continue.
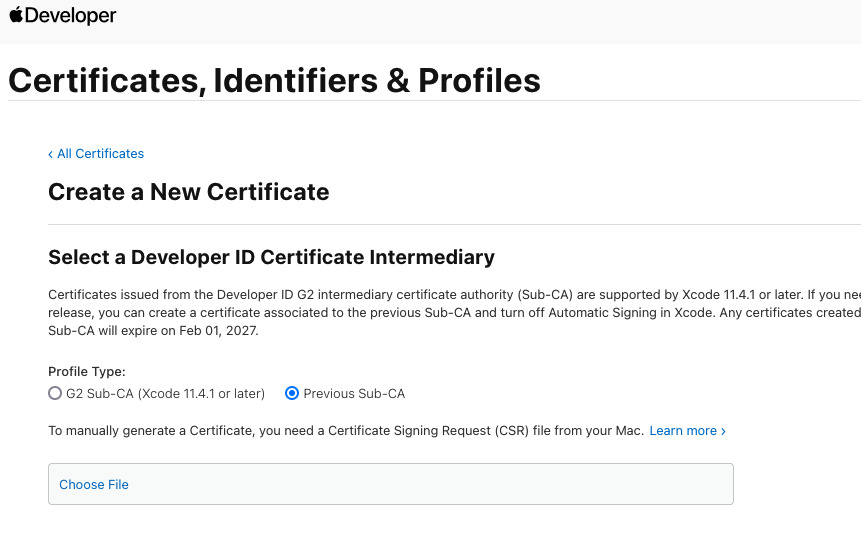
On the next screen, upload the certificate signing request we generated in step 4.
You’ll be prompted to download your certificate. Do it and add it to Keychain by double-clicking on the file.
You can check that your certificate was properly added by running the following command:
security find-identity -v -p codesigningIt should return (at least) one identity.
Step 6: Get an App Store Connect API Key
Back to the Apple Developer website, go to Users and Access, and open the Integrations tab. From this page, you should request access to the App Store Connect API. This access should normally be granted immediately.
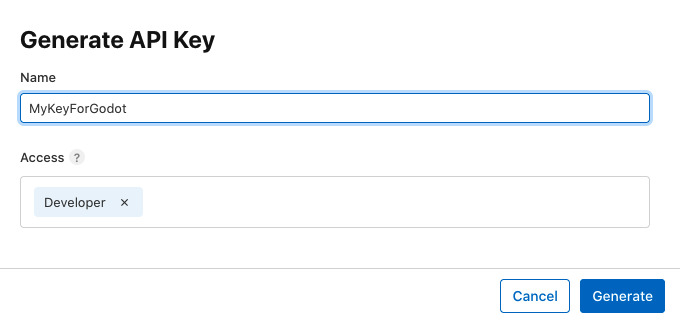
From this page, create a new key by clicking on the + icon. Give your key a name you will remember and give it the Developer access. Click on Generate and the key will be created.
You will then be prompted to download your key. Do it and store the file safely, as you will only be able to download it once.
Step 7: Configure Godot
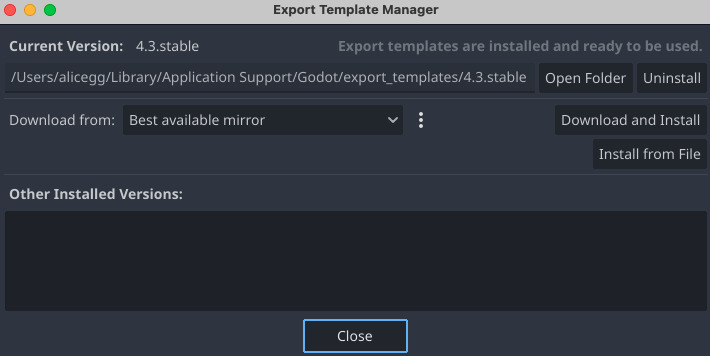
Open your Godot project and head to the project settings using the top menu (Project > Project Settings). From there search for VRAM Compression and check Import ETC2 ASTC.
Then make sure you have installed up-to-date export templates by going through the Editor > Manage Export Templates menu and clicking on Download and Install.
To export your project, head to the Project > Export. Click on Add and select macOS to create new presets. In the presets form on the left, you’ll have to fill in a unique Bundle Identifier in the Application section, this can be
com.yourcompany.yourgame.In the Codesign section, select Xcode codesign and fill in your Apple Team ID and Identity. Those can be found using the
security find-identity -v -p codesigningcommand: the first (~40 characters) part of the output is your identity, and the last (~10 characters, between parentheses) is your Team ID.In the Notarization section, select Xcode notarytool and fill in your API UUID (found on the appstoreconnect page), API Key (the file you saved in Step 6), and API Key ID (also found on the appstoreconnect page).
Click on Export Project… to start the export.
Step 8: Checking the notarization status
Godot will automatically send your exported file for notarization.
You can check the notarization progress by running:
xcrun notarytool history --key YOUR_AUTH_KEY_FILE.p8 --key-id YOUR_KEY_ID --issuer YOUR_ISSUER_IDAccording to Apple, the process should rarely take more than 15 minutes. Empirically, this is sometimes very false and the process can give you enough time to grab a coffee, bake a cake, and water your plants.
Once the notarization appears completed (with the status Valid or Invalid), you can run this command to check the result (using the job ID found in the previous command output):
xcrun notarytool log --key YOUR_AUTH_KEY_FILE.p8 --key-id YOUR_KEY_ID --issuer YOUR_ISSUER_ID YOUR_JOB_IDStep 9: Stapling your executable
To make sure that your executable can work offline, you are supposed to ‘staple’ the notarization to it. This is done by running the following command:
xcrun stapler staple MY_SOFTWARE.dmgExtra: Exporting the game as .app
Godot can export your game as .dmg, .zip, or .app. For most users, it is more convenient to receive the game as .app, as those can be directly executed. However, the notarization process doesn’t support uploading .app files to Apple’s server.
I think the proper way to obtain a notarized .app file is to:
- Export the project .dmg from Godot with code signing and notarization
- Mount the .dmg and extract the .app located inside of it
- Staple the .app bundle
Extra: Code signing GodotSteam
GodotSteam is a Godot add-on that wraps the Steam API inside GDscript. If you use it, you might encounter issues during notarization, because it adds a bunch of .dylib and .framework files.
What I did to work around that was to codesign the framework folders:
codesign --deep --force --verify --verbose --sign "Developer ID Application: My Company" libgodotsteam.macos.template_release.framework
codesign --deep --force --verify --verbose --sign "Developer ID Application: My Company" libgodotsteam.macos.template_debug.framework
I also checked the options Allow DyId environment variable and Disable Library Validation in the export settings (section Codesign > Entitlements).
FAQ: Is this really necessary if I’m just going to publish my game on Steam?
Actually, I’m not 100% sure, but I think it is only “recommended” and Steam can bypass the notarization. Steamworks does contain a checkbox asking if App Bundles Are Notarized, so I assume it might do something.
-
Posted on
Create a presskit in 10 minutes with Milou
Talking to the press is an inevitable part of marketing a game or software. To make the journalist’s job easier, it’s a good idea to put together a press kit. The press kit should contain all the information someone could want to write an article about your product, as well as downloadable, high-resolution assets.
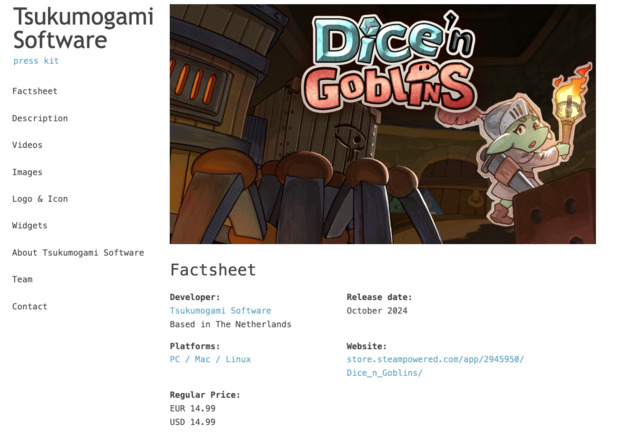
The press kit for our upcoming game Dice'n Goblins Introducing Milou
Milou is a NodeJS software that generates press kits in the form of static websites. It aims at creating beautiful, fast, and responsive press kits, using only YAML configuration files.
I built it on top of presskit.html, which solved the same problem but isn’t actively maintained at the moment. Milou improves on its foundation by using a more modern CSS, YAML instead of XML, and up-to-date Javascript code.
Installation
First, you will need to have NodeJS installed:
curl -o- https://raw.githubusercontent.com/nvm-sh/nvm/v0.39.7/install.sh | bash
nvm install 22
Once Node is ready, you can use NPM to install Milou:
npm install -g milouRunning
milou -Vshould display its version (currently 1.1.1).Let’s build a press kit
Let’s create a new project:
mkdir mypresskit
cd mypresskit
milou new
The root directory of your project will be used for your company. In this directory, the file
data.ymlshould contain data about your company, such as your company name, location, website, etc… You can find an example of a fully completed companydata.ymlfile on GitHub. To validate that your file is a valid YAML file, you can use an online validator.Your company directory should contain a sub-folder called
images, you should put illustrations you want to appear in your press kit inside it. Any file namedheader.***will be used as the page header,favicon.icowill be used as the page favicon, and files prefixed by the wordlogowill appear in a dedicated logo section of the page (eg.logo01.pngorlogo.jpg). Other images you put in this folder will be included in your page, in the Images section.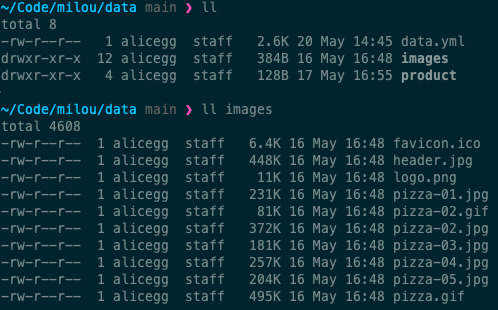
The directory structure After completing your company page, we can create a product page. This will be done in a subfolder:
mkdir myproduct
cd myproduct
milou new -t product
Just like for a company, you should fill in the
data.ymlfile with info about your product, like its title, features, and prices. You can find an example of a product file on GitHub. The product folder should also contain animagessubfolder. It works the same way as for the company.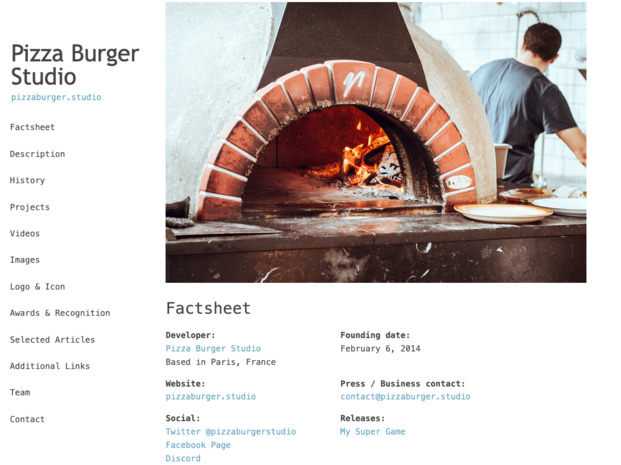
The example press kit When your product is ready, go back to the company folder and build the press kit:
cd ../
milou build .
This will generate the HTML and CSS files for your online presskit in the directory
build. You can then use any web server to access them. For example, this will make them accessible fromhttp://localhost:3000/cd build npx serveTo put your press kit online, you can upload this folder to any static site host, like CloudFlare Pages, Netlify, or your own server running Nginx.
Conclusion
Milou is still quite new, and if you encounter issues while using it, don’t hesitate to open an issue. And if it works perfectly for you, leave a star on GitHub.
subscribe via RSS