Is technical analysis just stock market astrology?
Technical analysis is a part of finance that studies price moves to guide investment decisions. A lot of investors seem skeptical of the use of past price data, which leads to technical analysis often being perceived as similar to astrology. In this article, I will try to see if it can provide an edge to long-term investors and if it beats reading the horoscope.
Moving Average Crossover
There are hundreds of different technical analysis strategies and indicators out there. For this article, I decided to pick what seemed to be one of the simplest: SMA crossovers.
Simple Moving Averages (SMA) are, as the name suggests, just an average of past closing prices. The SMA Crossover strategy uses two moving averages, a “fast” one (50 days) and a “slow” one (200 days), and compares them to decide on buying or selling an asset. If the fast SMA is above the slow one, we should buy and hold the stock, and if this condition inverts, we should sell. It is a heuristic around momentum, which is the idea that if an asset price starts rising, we can jump on the bandwagon and hope it will continue its trajectory.
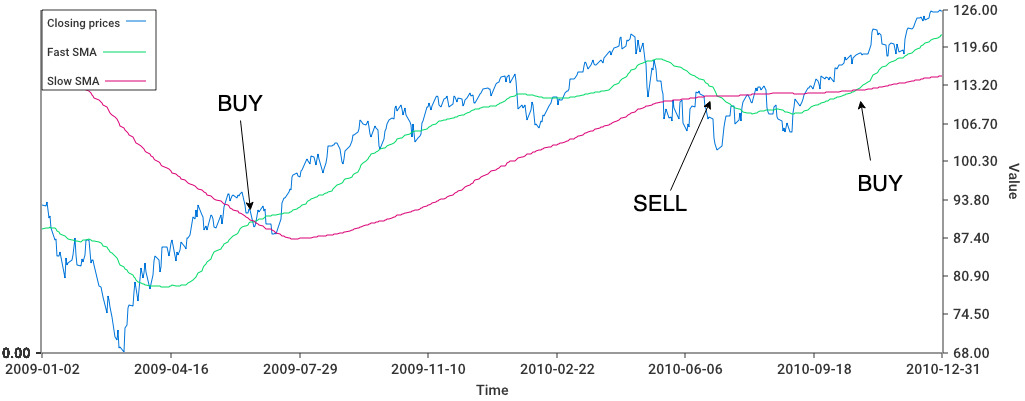
I have backtested an SMA crossover strategy on the SPY ETF, one of the most traded passive investment funds in the world. My backtest makes the following assumptions:
- we do not pay any transaction fees
- we will obtain exactly the close price when buying or selling
- dividends received while holding stocks are immediately reinvested
- cash yields no interests
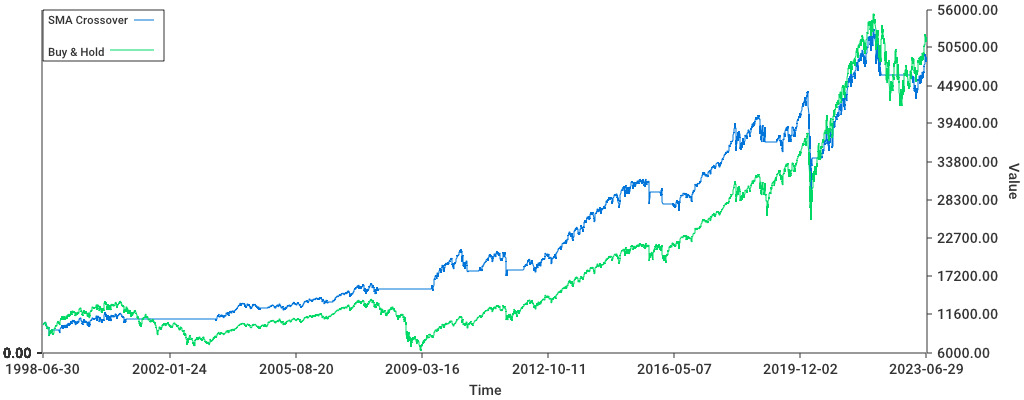
While someone who would have bought 10.000$ of SPY in July 1998 and continuously held the stock would have ended up with 52.030$ in June 2023 (6.78% annualized), an investor using the SMA crossover strategy would have made ended up with 49.127$. (6.54%). Even without accounting for transaction costs, the SMA crossover strategy doesn’t provide a significant over-performance to simply buying and holding over a long period.
Does this mean that this strategy is completely useless?
Actually no, a closer look at the data will show that the SMA crossover strategy allows investors to avoid extended drawdowns, like the 2008 crisis. This significantly reduces the risk taken by investors: the yearly standard deviation of the SMA crossover strategy is only 13%, against 19% for the buy and hold strategy. Since returns didn’t decrease as much as risk, this leads to high risk-adjusted returns, as measured by the Sharpe ratio: 0.43 for passive investing vs 0.53 for SMA crossovers.
But what about astrology?
Of course, the subject of this article wasn’t to compare technical analysis to buy and hold, but to astrology. I was surprised to learn that financial astrology was actually a thing and that there were also a lot of astrology-related strategies out there. I decided to implement a strategy based on lunar cycles since it was one of the clearest about when to buy and when to sell.
The strategy goes as follows: we purchase SPY on a new moon, and re-sell it on the next full moon. And repeat that every lunar month.
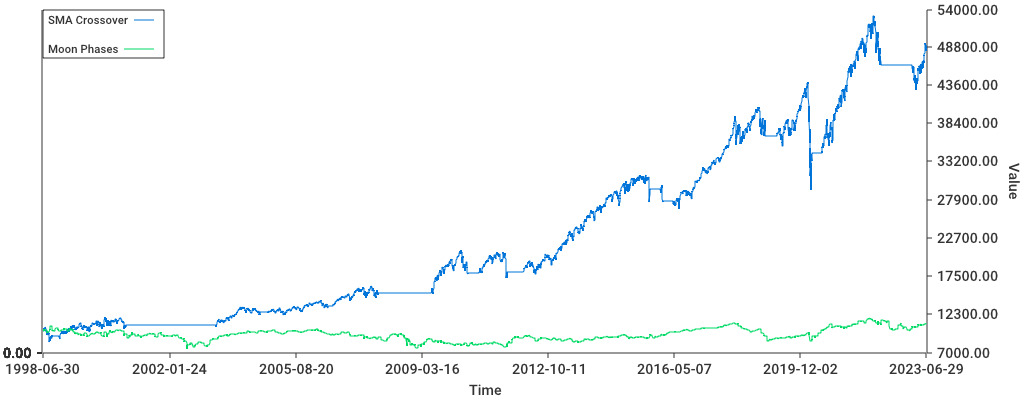
Clearly, it fails at beating SMA crossovers. Or at doing basically anything, an investor using the moon phase strategy starting with 10.000$ would end up with only 11.110$ and a Sharpe ratio of only 0.09.
Conclusion
Similarly to diversification, simple technical analysis strategies can be used to minimize investment risk, without necessarily reducing profits by the same amount. There’s however no guarantee that a strategy that worked in the past will continue working in the future. It is also likely that there exist smarter momentum indicators than moving averages, but you’ll have to do your own backtests for those.