-
Posted on
Self-hosting your code on Gitea
Afraid of GitHub suddenly enshittifying their product? The best way to shield yourself from that is to start self-hosting your code repositories. I have been running a self-hosted instance of Gitea for around two months, and so far the process has been pretty close to painless.

Photo by Content Pixie Preparing a machine
To install Gitea, all you need is a server with 2 GB RAM and 2 CPU cores. The official documentation even says a single GB of RAM is enough, which I can believe, but a bit of margin will not hurt.
Once your server is started and configured as you like, you’ll need to prepare a database. Gitea supports both MySQL and PostgreSQL. Personally, I like MySQL a lot, so I decided to go with that.
Using docker-compose, you can launch a MySQL container like this:
  mysql:
    image: mysql:8.4
    restart: always
    volumes:
      - ./mysql_data:/var/lib/mysql
    environment:
      MYSQL_ROOT_PASSWORD: "SUPER_SECRET_PASSWORD"
    healthcheck:
      test: mysqladmin ping -pSUPER_SECRET_PASSWORD
It will write data to the
mysql_datafolder and use theSUPER_SECRET_PASSWORDpassword. You can then connect to this database by doing:docker compose exec mysql mysql -uroot -pSUPER_SECRET_PASSWORDFrom the database, you just have to create a
giteauser on thegiteadatabase:CREATE USER 'gitea'@'%' IDENTIFIED BY 'TOP_SECRET_PASSWORD'; CREATE DATABASE gitea CHARACTER SET 'utf8mb4' COLLATE 'utf8mb4_bin'; GRANT ALL PRIVILEGES ON gitea.* TO 'gitea'; FLUSH PRIVILEGES;Installing Gitea
Installing Gitea itself is very straightforward. It is a single process that you can launch through a single binary.
I use docker-compose to make networking easier, since I launched MySQL that way:
  gitea:
    image: docker.gitea.com/gitea:1.24.6-rootless
    restart: always
    volumes:
      - ./gitea-data:/var/lib/gitea
      - ./gitea-config:/etc/gitea
      - /etc/timezone:/etc/timezone:ro
      - /etc/localtime:/etc/localtime:ro
    ports:
      - "80:3000"
      - "2222:2222"
    depends_on:
      mysql:
        condition: service_healthy
It will write files and other unstructured data to
gitea-dataand read its configuration file fromgitea-config. HTTP traffic will be received on the port 80 and forwarded to 3000, while SSH traffic (used by git itself) will use port 2222. We do not use port 22 to avoid conflicts with the server’s own SSH daemon.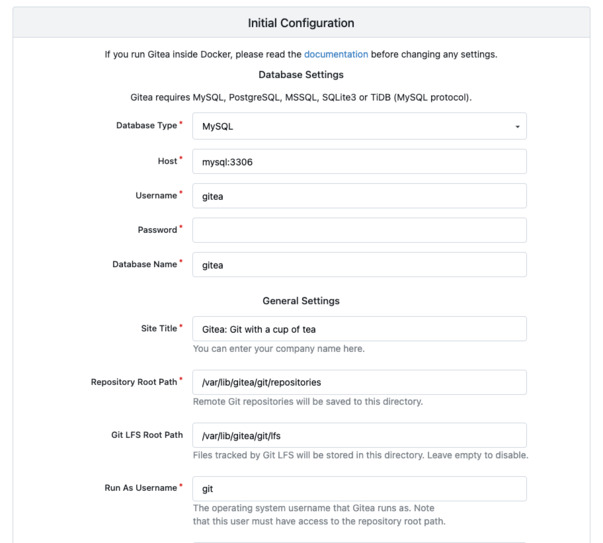
As soon as the container is ready, you can head connect to Gitea with your web browser at your server’s IP/domain. It will open an installation wizard, and you just have to follow the instructions. Through this installation wizard, you should be able to connect to the previously configured MySQL server using the address
mysql:3306and the user you created earlier.Setting up TLS
Just because we are self-hosting doesn’t mean we have to forgo basic security rules. Using Traefik is, in my opinion, the simplest way to set up TLS on your own server.
First we will need to launch a Traefik container:
  traefik:
    image: traefik:v3.5
    restart: always
    command:
      - "--providers.docker=true"
      - "--entrypoints.websecure.address=:443"
      - "--entrypoints.web.address=:80"
      - "--entrypoints.web.http.redirections.entryPoint.to=websecure"
      - "--entrypoints.web.http.redirections.entryPoint.scheme=https"
      - "--entrypoints.web.http.redirections.entrypoint.permanent=true"
      - "--certificatesresolvers.myresolver.acme.tlschallenge=true"
      - "--certificatesresolvers.myresolver.acme.email=YOUR@EMAIL.COM"
      - "--certificatesresolvers.myresolver.acme.storage=/letsencrypt/acme.json"
    ports:
      - "80:80"
      - "443:443"
    volumes:
      - ./letsencrypt:/letsencrypt
      - /var/run/docker.sock:/var/run/docker.sock
    depends_on:
      - gitea
This container will create two entry points:
- websecure, that will receive the TLS-traffic on port 443
- web, that will receive the unsecured traffic on port 80 and simply redirect to websecure
It will also use TLS challenges to prove you own the server to Let’s Encrypt and receive a valid certificate.
You will need to add labels on the
giteacontainer to receive connections from thewebsecureentry point on port 3000:gitea: image: docker.gitea.com/gitea:1.24.6-rootless restart: always volumes: - ./gitea-data:/var/lib/gitea - ./gitea-config:/etc/gitea - /etc/timezone:/etc/timezone:ro - /etc/localtime:/etc/localtime:ro ports: - "2222:2222" labels: - "traefik.http.routers.gitea.rule=Host(`COOL.DOMAIN.COM`)" - "traefik.http.routers.gitea.entrypoints=websecure" - "traefik.http.routers.gitea.tls.certresolver=myresolver" - "traefik.http.services.gitea.loadbalancer.server.port=3000" depends_on: mysql: condition: service_healthyLastly, if you didn’t do it during installation, you should indicate the proper domain and URL in Gitea’s config. It is found in the
gitea-config/app.inifile.[server] SSH_DOMAIN = COOL.DOMAIN.COM ROOT_URL = https://COOL.DOMAIN.COM/ DOMAIN = COOL.DOMAIN.COMAfter restarting everything, crossing fingers and waiting a bit, you should receive a valid TLS certificate and be able to use Gitea safely.
Importing repositories from GitHub
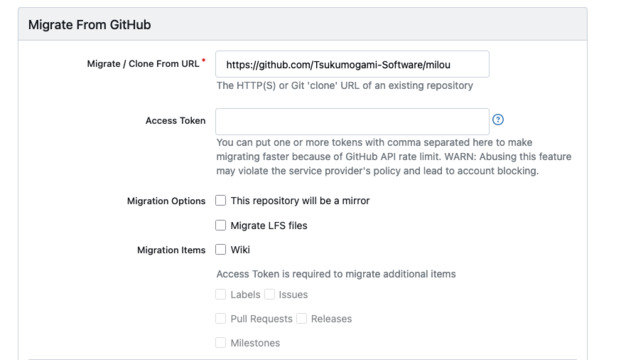
You can automatically import repositories from GitHub into Gitea. You can find the import tool on the + button located in the top right corner of your screen.
In addition to importing the code, Gitea can automatically retrieve existing labels, issues, pull requests, releases, and milestones using a Personal Access Token.
Compared to alternatives like GitLab, the killer feature of Gitea is that you do not need to rewrite your GitHub Action workflows. So you can just leave your YAML files untouched in
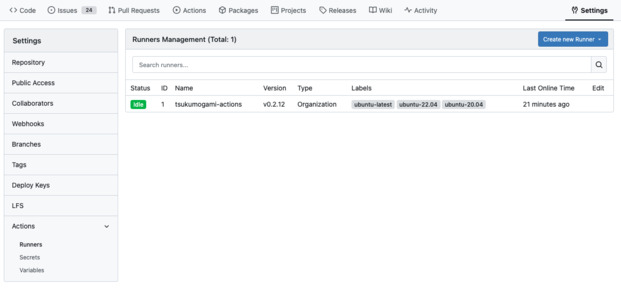
.github/workflows.You will need to start some Runner processes to run your Actions.
First, you’ll have to generate a Runner registration token from your instance, organization or repository setting. As you may have guessed, a Runner with a registration token created from a repository will only be able to access this repository, while a runner created from the instance settings will be able to access every repository.
When you have a token, you can launch a runner container like this:
  gitea-runner:
    image: docker.io/gitea/act_runner:0.2.13
    environment:
      CONFIG_FILE: /config.yaml
      GITEA_INSTANCE_URL: "https://COOL.DOMAIN.COM"
      GITEA_RUNNER_REGISTRATION_TOKEN: "TOKEN_YOU_JUST_GENERATED"
      GITEA_RUNNER_NAME: "actions-runner"
    volumes:
      - ./runner-config.yaml:/config.yaml
      - ./runner-data:/data
      - /var/run/docker.sock:/var/run/docker.sock
For scalability and security reasons, this can, and probably should, be done from a second machine.
Backing up Gitea
While I’ve not encountered any issues operating Gitea so far, it is important to do regular backups to avoid losing work in case something goes wrong.
Gitea provides a built-in backup utility called
gitea dump. You can invoke it using Docker like that:docker exec -u git -it -w --tempdir ./temp $(docker ps -qf 'name=gitea-1$') bash -c '/usr/local/bin/gitea dump -c /etc/gitea/app.ini'Alternatively, you should be able to back up the MySQL database using
mysqldumpand make zip of Gitea local volumes.Backups have to be copied to a service you trust, and that is independent of where your server is hosted. Every major cloud provider offers reasonably cheap object storage that can be used for this.
-
Posted on
Building Itako: an investment tracking application
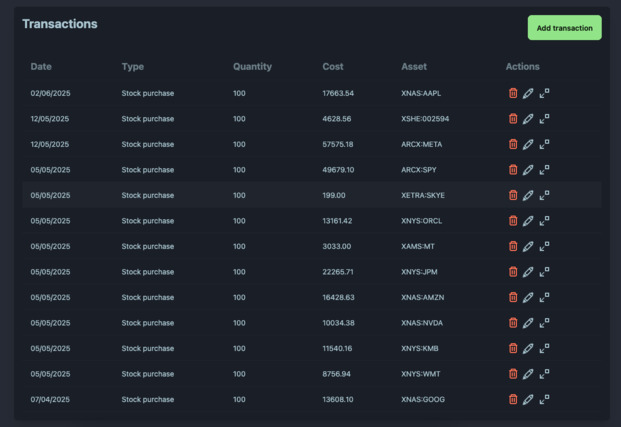
Around 2 years ago, I had some time on my hands and got really interested into investing and playing with stock market data. After reading way too many books on the subject, I started building my own tools which led me to creating Itako. It’s a portfolio tracking and data visualization software that lets user journal their stock market transactions, and learn about their portfolio performance and diversification.
Itako is now in a stable state, with enough features, so I felt like it was a good time to summarize this project.
A prototype
The very first thing I did was to create a script that could generate random walks to simulate investment returns over time, and return the graph in the CLI. This was fairly simple, and 250 lines of Python later, I could visualize those random walks going up and down.
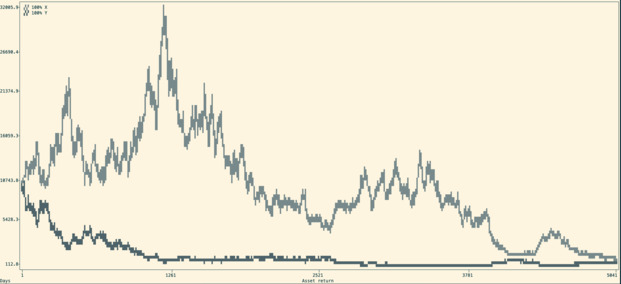
It allowed me to write my Shannon’s demon article, which explains the non-intuitive advantage of diversification and regular re-balancing.
Of course, you can’t really go that far with random walks. Soon after this first step was finished, I decided to integrate real data from the stock market.
Once my little script was able to fetch stock quotes from an API, I was able to do some fun things like compute the correlations between different tickers, or evaluate different strategies.
Edelfelt
As I started building more and more stuff, I got tired of playing with a bunch of Python scripts. I decided to consolidate my project in the form of a CLI that would act as a Swiss-army knife for my experiments. I called it Edelfelt.
For this iteration, I also switched from Python to Go. Since the project was growing, Go allows me to really easily create robust and maintainable code that I can still painlessly work with years after.
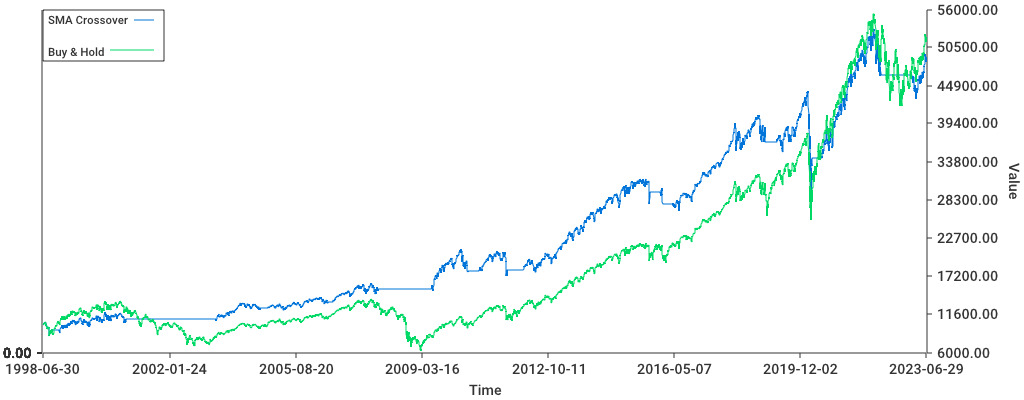
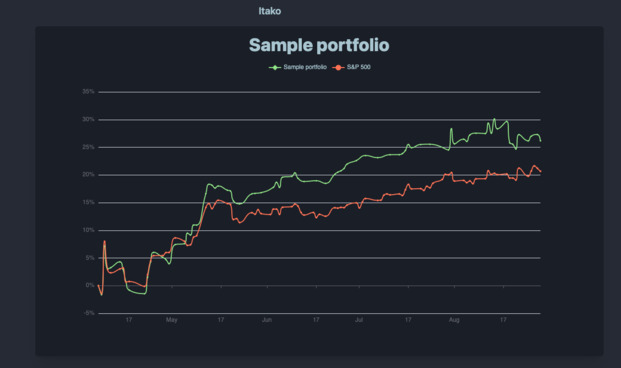
Edelfelt was able to read a list of transactions, turn this into a portfolio which is made up of different positions over time. From this portfolio, it generates a graph, but also output metrics such as the portfolio’s Sharpe ratio (basically the return/risk), compounded returns, total returns, and standard deviation.
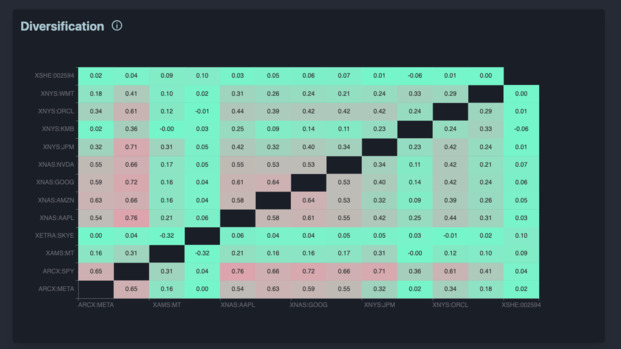
It could quickly be used to get a portfolio correlation matrix (showing if any 2 positions behave similarly), and weights vector (the % each position is taking in your portfolio). Lastly, you could use it to compare the portfolio to a benchmark (like the S&P500 or the 10-year US treasuries) and determine the excess returns from our strategies.
Alpha
To make this useable by other people I decided to turn this into a web application, named Itako. I decided to re-use Mikochi’s stack, which is Go and Gin for the backend with a Preact frontend.
For a database, I decided to go with MySQL, because it is the only major database system that I have never seen catastrophically fail in production. The data visualization got a serious upgrade, thanks to Echarts (which is really awesome). I also decided to use DaisyUI to get some shiny looking CSS.
The backend used the previous code from Edelfelt as a module. This avoided me from having to re-develop everything from scratch. The main improvement is that now, we could cache stock prices in our database. I didn’t expect that to be complicated, sadly cache invalidation is a pain.
When I had a decent bunch of features to work with, I pushed the application to production and got around a dozen people to try it. People liked the visualizations, but also found a lot of bugs. Most were pretty minor UI issues, but some were more tricky. I hadn’t planned for some situations, like stock splits and delistings.
Beta
Aside from fixing the bugs noticed during the Alpha testing, the next step was to handle currency conversions. The aim of this was to let people have stocks from different countries in their portfolios.
Getting currencies data is relatively simple since there’s a lot of APIs offering that. However, it completely changes how investment returns are calculated. This led me to refactoring Itako’s business logic and completely getting rid of the dependency to Edelfelt.
I decided to go a bit more public about the project and made a Reddit post about it. Around 100 users decided to try Itako and I received plenty of feedback. The main point I learned from this was that I needed to focus on making the application a bit easier to use, and give more actionable data.
Release
To be honest, the project sat abandoned for a long while after this round of Beta testing. Nothing bad about it, I just really had to focus on shipping our Dice’n Goblins in time.
After the game release, I manage to find a bit of time to work on Itako again. I shipped quite a few improvements. Users can now use a simplified input form and abstract away handling cash. Those who do not like this can head to their settings and change it back.
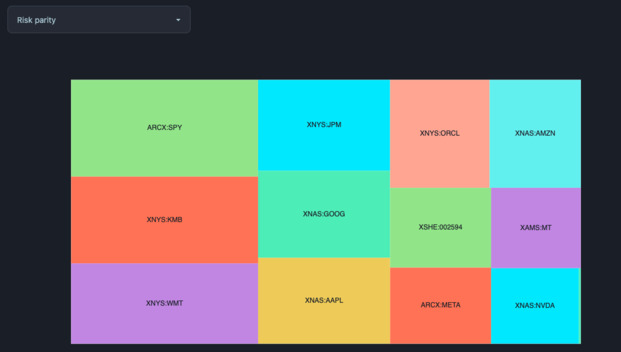
I also added a bit of polish, and added a much needed rebalancing feature. This feature shows you the output of different rebalancing strategies on your portfolio. Currently, it implements two very common strategies: equal weights and risk parity.
Quite recently, Itako removed its “Beta” badge. The project has most of the features I wanted to build when I created it. It feels weird saying it because I spent way too much time on this, but it is finished.
If you want to try it out, just head to itako.app. If you have questions, feedback, or encountered any issues while using Itako, don’t hesitate to email me about it.
-
Posted on
Playing with open source LLMs
Every 6 months or so, I decide to leave my cave and check out what the cool kids are doing with AI. Apparently the latest trend is to use fancy command line tools to write code using LLMs. This is a very nice change, since it suddenly makes AI compatible with my allergy to getting out of the terminal.

Me, browsing HN from my cave (by Stable Diffusion) The most popular of these tools seems to be Claude Code. It promises to be able to build in total autonomy, being able to use search code, write code, run tests, lint, and commit the changes. While this sounds great on paper, I’m not keen on getting locked into vendor tools from an unprofitable company. At some point, they will either need to raise their prices, enshittify their product, or most likely do both.
So I went looking for what the free and open source alternatives are.
Picking a model
There’s a large amount of open source large language models on the market, with new ones getting released all the time. However, they are not all ready to be used locally in coding tasks, so I had to try a bunch of them before settling on one.
deepseek-r1:8b
Deepseek is the most popular open source model right now. It was created by the eponymous Chinese company. It made the news by beating numerous benchmarks while being trained on a budget that is probably lower than the compensation of some OpenAI workers. The 8b variant only weights 5.2 GB and runs decently on limited hardware, like my three years old Mac.
This model is famous for forgetting about world events from 1989, but also seems to have a few issues when faced with concrete coding tasks. It is a reasoning model, meaning it “thinks” before acting, which should lead to improved accuracy. In practice, it regularly gets stuck indefinitely searching where it should start and jumping from one problem to the other in a loop. This can happen even on simple problems, and made it unusable for me.
mistral:7b
Mistral is the French alternative to American and Chinese models. I have already talked about their 7b model on this blog. It is worth noting that they have kept updating their models, and it should now be much more accurate than two years ago.
Mistral is not a reasoning model, so it will jump straight to answering. This is very good if you’re working with tasks where speed and low compute use are a priority. Sadly, the accuracy doesn’t seem good enough for coding. Even on simple tasks, it will hallucinate functions or randomly delete parts of the code I didn’t want to touch.
qwen3:8b
Another model from China, qwen3 was created by the folks at Alibaba. It also claims impressive benchmark results, and can work as both a reasoning or non-thinking model. It was made with modern AI tooling in mind, by supporting MCPs and a framework for agentic development.
This model actually seems to work as expected, providing somewhat accurate code output while not hanging in the reasoning part. Since it runs decently on my local setup, I decided to stick to that model for now.
Setting up a local API with Ollama
Ollama is now the default way to download and run local LLMs. It can be simply installed by downloading it from their website.
Once installed, it works like Docker for models, by giving us access to commands like
pull,run, orrm. Ollama will expose an API onlocalhostwhich can be used by other programs. For example, you can use it from your Python programs through ollama-python.
My new pet (by Stable Diffusion) Pair programming with aider
The next piece of software I installed is aider. I assume it’s pronounced like the French word, but I could not confirm that. Aider describes itself as a “pair programming” application. Its main job is to pass context to the model, let it write the output to files, run linters, and commit the changes.
Getting started
It can be installed using the official Python package or via Homebrew if you use Mac. Once it is installed, just navigate to your code repository and launch it:
export OLLAMA_API_BASE=http://127.0.0.1:11434
aider --model ollama_chat/qwen3:8b
The CLI should automatically create some configuration files and add them to the repo’s
.gitignore.Usage
Aider isn’t meant to be left alone in complete autonomy. You’ll have to guide the AI through the process of making changes to your repository.
To start, use the
/addcommand to add files you want to focus on. Those files will be passed entirely to the model’s context and the model will be able to write in them.You can then ask questions using the
/askcommand. If you want to generate code, a good strategy can be to starting by requesting a plan of actions.When you want it to actually write to the files, you can prompt it using the
/codecommand. This is also the default mode. There’s no absolute guarantee that it will follow a plan if you agreed on one previously, but it is still a good idea to have one.The
/architectcommand seems to automatically ask for a plan, accept it, and write the code. The specificity of this command is that it lets you use different models to plan and write the changes.Refactoring
I tried coding with aider in a few situations to see how it performs in practice.
First, I tried making it do a simple refactoring on Itako, which is a project of average complexity. When pointed to the exact part of code where the issues happened, and explained explicitly what to do, the model managed to change the target struct according to the instructions. It did unexpectedly change a function that was outside the scope of what I asked, but this was easy to spot.
On paper, this looks like a success. In practice, the time spent crafting a prompt, waiting for the AI to run and fixing the small issue that came up immensely exceeds the 10 minutes it would have taken me to edit the file myself. I don’t think coding that way would lead me to a massive performance improvement for now.
Greenfield project
For a second scenario, I wanted to see how it would perform on a brand-new project. I quickly set up a Python virtual environment, and asked aider to work with me at building a simple project. We would be opening a file containing Japanese text, parsing it with fugashi, and counting the words.
To my surprise, this was a disaster. All I got was a bunch on hallucination riddled python that wouldn’t run under any circumstances. It may be that the lack of context actually made it harder for the model to generate code.
Troubleshooting
Finally, I went back to Itako, and decided to check how it would perform on common troubleshooting tasks. I introduced a few bugs to my code and gathered some error messages. I then proceeded to simply give aider the files mentioned by the error message and just use
/askto have it explain the errors to me, without requiring it to implement the code.This part did work very well. If I compare it with Googling unknown error messages, I think this can cut the time spent on the issue by half This is not just because Google is getting worse every day, but the model having access to the actual code does give it a massive advantage.
I do think this setup is something I can use instead of the occasional frustration of scrolling through StackOverflow threads when something unexpected breaks.
What about the Qwen CLI?
With everyone jumping on the trend of CLI tools for LLMs, the Qwen team released its own Qwen Code. It can be installed using npm, and connects to a local model if configured like this:
export OPENAI_API_KEY="ollama"
export OPENAI_BASE_URL="http://localhost:11434/v1/"
export OPENAI_MODEL="qwen3:8b"
Compared to aider, it aims at being fully autonomous. For example, it will search your repository using
grep. However, I didn’t manage to get it to successfully write any code.The tool seems optimized for larger, online models, with context sizes up to 1M tokens. Our local qwen3 context only has a 40k tokens context size, which can get overwhelmed very quickly when browsing entire code repositories.
Even when I didn’t run out of context, the tool mysteriously failed when trying to write files. It insists it can only write to absolute paths, which the model doesn’t seem to agree with providing. I did not investigate the issue further.
-
Posted on
Building a container orchestrator
Kubernetes is not exactly the most fun piece of technology around. Learning it isn’t easy, and learning the surrounding ecosystem is even harder. Even those who have managed to tame it are still afraid of getting paged by an ETCD cluster corruption, a Kubelet certificate expiration, or the DNS breaking down (and somehow, it’s always the DNS).

Photo by Samuel Sianipar If you’re like me, the thought of making your own orchestrator has crossed your mind a few times. The result would, of course, be a magical piece of technology that is both simple to learn and wouldn’t break down every weekend.
Sadly, the task seems daunting. Kubernetes is a multi-million lines of code project which has been worked on for more than a decade.
The good thing is someone wrote a book that can serve as a good starting point to explore the idea of building our own container orchestrator. This book is named “Build an Orchestrator in Go”, written by Tim Boring, published by Manning.
The tasks
The basic unit of our container orchestrator is called a “task”. A task represents a single container. It contains configuration data, like the container’s name, image and exposed ports. Most importantly, it indicates the container state, and so acts as a state machine. The state of a task can be Pending, Scheduled, Running, Completed or Failed.
Each task will need to interact with a container runtime, through a client. In the book, we use Docker (aka Moby). The client will get its configuration from the task and then proceed to pull the image, create the container and start it. When it is time to finish the task, it will stop the container and remove it.
The workers
Above the task, we have workers. Each machine in the cluster runs a worker. Workers expose an API through which they receive commands. Those commands are added to a queue to be processed asynchronously. When the queue gets processed, the worker will start or stop tasks using the container client.
In addition to exposing the ability to start and stop tasks, the worker must be able to list all the tasks running on it. This demands keeping a task database in the worker’s memory and updating it every time a task change’s state.
The worker also needs to be able to provide information about its resources, like the available CPU and memory. The book suggests reading the
/procLinux file system using goprocinfo, but since I use a Mac, I used gopsutil.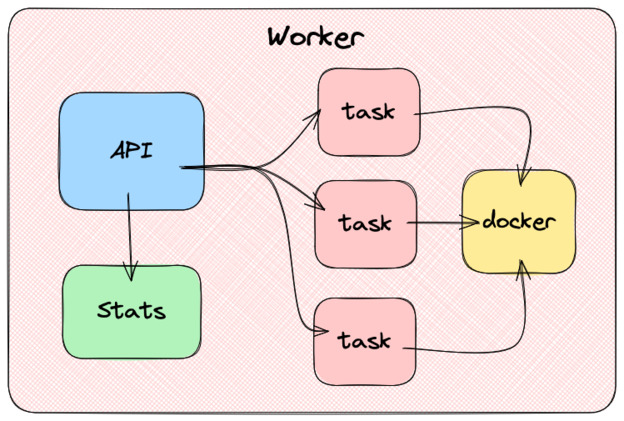
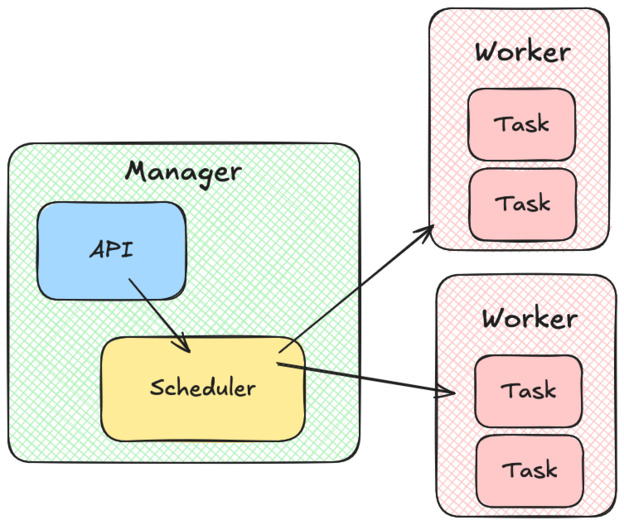
The manager
On top of our cluster of workers, we have the manager. The manager also exposes an API, which allows us to start, stop, and list tasks on the cluster.
Every time we want to create a new task, the manager will call a scheduler component. The scheduler has to list the workers that can accept more tasks, assign them a score by suitability and return the best one. When this is done, the manager will send the work to be done using the worker’s API.
In the book, the author also suggests that the manager component should keep track of every tasks state by performing regular health checks. Health checks typically consist of querying an HTTP endpoint (i.e.
/ready) and checking if it returns 200. In case a health check fails, the manager asks the worker to restart the task.I’m not sure if I agree with this idea. This could lead to the manager and worker having differing opinions about a task state. It will also cause scaling issues: the manager workload will have to grow linearly as we add tasks, and not just when we add workers.
As far as I know, in Kubernetes, Kubelet (the equivalent of the worker here) is responsible for performing health checks.
The CLI
The last part of the project is to create a CLI to make sure our new orchestrator can be used without having to resort to firing up curl. The CLI needs to implement the following features:
- start a worker
- start a manager
- run a task in the cluster
- stop a task
- get the task status
- get the worker node status
Using cobra makes this part fairly straightforward. It lets you create very modern feeling command-line apps, with properly formatted help commands and easy argument parsing.
Once this is done, we almost have a fully functional orchestrator. We just need to add authentication. And maybe some kind of DaemonSet implementation would be nice. And a way to handle mounting volumes…
-
Posted on
Discord considered harmful
In the past few years, social media use has gained a bad reputation. More or less everyone is now aware that TikTok is ruining your attention span, and Twitter is radicalizing you into extreme ideologies. But, despite its enormous popularity amongst technology enthusiasts, there’s not a lot of attention given to Discord.
I personally have been using Discord so much for so long that the majority of my social circle is made of people I met through the platform. I even spent two years of my life helping run the infrastructure behind the most popular Bot available on Discord. In this article, I will try to give my perspective on Discord, why I think it is harmful, and what can we do about it.

Photo by appshunter.io A tale of two book clubs
To explain my point of view about Discord, I will compare the experience between joining a real-life book-club, and one that communicates exclusively through Discord. This example is about books, but the same issues would apply if it was a community talking about investing, knitting, or collecting stamps. As Marshall McLuhan showed last century, examining media should be done independently of their content.
In the first scenario, we have Bob. Bob enjoys reading books, which is generally a solitary hobby. To break this solitude, Bob decides to join a book club. This book club reunites twice a month in a library where they talk about a new book each time.
In the second scenario, we have Alice. Alice also likes books. Alice also wants to meet fellow book lovers. Being a nerd, Alice decides to join a Discord server. This server does not have fixed meeting times. Most users simply use the text channels to talk about what they are reading anytime during the day.
Crumbs of Belongingness
In Bob’s book club, a session typically lasts an hour. First, the librarian takes some time to welcome everyone and introduce newcomers. After, that each club member talks about the book they were expected to read. They can talk about what they liked and disliked, how the book made them feel, and the chapters they found particularly noteworthy. Once each member had the time to talk about the book, they vote on the book they are going to read for the next date. After the session is concluded, some members move to the nearest coffeehouse to keep talking.
During this session of one hour, Bob spent around one hour socializing. The need for belongingness that drove Bob to join this book club is fully met.
On Alice’s side, the server is running 24/7. When she opens the app, even if there are sometimes more than 4000 members of her virtual book club online, most of the time, nobody is talking. If she was to spend an entire hour staring at the server she might witness a dozen or so messages. Those messages may be part of small conversations in which Alice can take part. Sadly, most of the time they will be simple uploads of memes, conversations about books she hasn’t read, or messages that do not convey enough meaning to start a conversation.
In one hour of constant Discord use, Alice’s need for socializing has not been met.

Photo by Susan Q Yin The shop is closed
Even if Bob’s library is open every day, the book club is only open for a total of two hours a month. It is enough for Bob. Since the book club fulfills his need, he doesn’t want it to be around for longer. He has not even entertained the thought of joining a second book club, because too many meetings would be overwhelming.
For Alice, Discord is always available. No matter if she is at home or away, it is always somewhere in her phone or taskbar.
At any moment of the day, she might notice a red circle above the icon. It tells her there are unread messages on Discord. When she notices that, she instinctively stops her current task and opens the app to spend a few minutes checking her messages.
Most of the time those messages do not lead to a meaningful conversation. Reading a few messages isn’t enough to meet her need for socialization. So, after having scrolled through the messages, she goes back to waiting for the next notification.
Each time she interrupts her current task to check Discord, getting back into the flow can take several minutes or not happen at all. This can easily happen dozens of times a day and cost Alice hundreds of hours each month.
Book hopping
When Bob gets home, the club only requires him to read the next book. He may also choose to read two books at the same time, one for the book club and one from his personal backlog. But, if he were to keep his efforts to a strict minimum, he would still have things to talk about in the next session.
Alice wants to be able to talk with other users about the books they are reading. So she starts reading the books that are trending and get mentionned often.
The issue is, Discord’s conversation are instantaneous, and instantaneity compresses time. A book isn’t going to stay popular and relevant for two whole weeks, if it manages to be the thing people talk about for two whole days, it’s already great. Alice might try to purchase and read two to three books a week to keep up with the server rythm.
Even if books are not terribly expensive, this can turn a 20 $/month hobby into a 200 $/month hobby. In addition to that, if reading a book takes Alice on average 10 hours, reading 3 books a week would be like adding a part-time job to her schedule. All this, while being constantly interrupted by the need to check if new conversations have been posted to the server.

Photo by visnu deva Quitting Discord
If you are in Alice’s situation, the solution is quite simple: use Discord less, ideally not at all.
On my side, I’ve left every server that is not relevant to my current work. I blocked
discord.comfrom the DNS of my coding computer (using NextDNS) and uninstalled the app from my phone. This makes the platform only usable as a direct messaging app, exclusively from my gaming device, which I cannot carry with me.I think many people realize the addictive nature of Discord, yet keep using the application all the time. One common objection to quitting the platform, is that there’s a need for an alternative: maybe we should go back to forums, or IRC, or use Matrix, etc… I don’t think any alternative internet chat platform can solve the problem.
The real problem is that we want to be able to talk to people without leaving home, at any time, without any inconvenience. But what we should do is exactly that, leave home and join a real book club, one that is not open 24/7, and one where the members take the time to listen to each other.
In the software community, we have also been convinced that every one of our projects needs to be on Discord. Every game needs a server, open-source projects offer support on Discord, and a bunch of AI startups even use it as their main user interface. I even made a server for Dice’n Goblins.
I don’t think it’s really that useful. I’m not even sure it’s that convenient. Popular games are not popular because they have big servers, they have big servers because they are popular. Successful open-source projects often don’t even have a server.
subscribe via RSS