Building Itako: an investment tracking application
Around 2 years ago, I had some time on my hands and got really interested into investing and playing with stock market data. After reading way too many books on the subject, I started building my own tools which led me to creating Itako. It’s a portfolio tracking and data visualization software that lets user journal their stock market transactions, and learn about their portfolio performance and diversification.
Itako is now in a stable state, with enough features, so I felt like it was a good time to summarize this project.
A prototype
The very first thing I did was to create a script that could generate random walks to simulate investment returns over time, and return the graph in the CLI. This was fairly simple, and 250 lines of Python later, I could visualize those random walks going up and down.
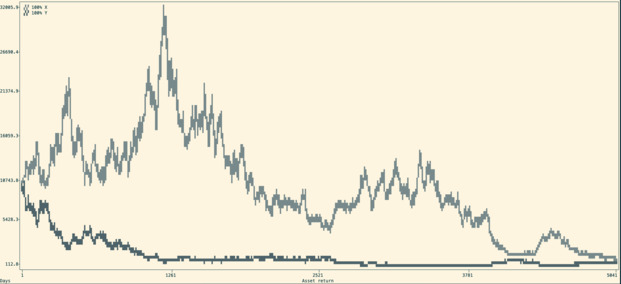
It allowed me to write my Shannon’s demon article, which explains the non-intuitive advantage of diversification and regular re-balancing.
Of course, you can’t really go that far with random walks. Soon after this first step was finished, I decided to integrate real data from the stock market.
Once my little script was able to fetch stock quotes from an API, I was able to do some fun things like compute the correlations between different tickers, or evaluate different strategies.
Edelfelt
As I started building more and more stuff, I got tired of playing with a bunch of Python scripts. I decided to consolidate my project in the form of a CLI that would act as a Swiss-army knife for my experiments. I called it Edelfelt.
For this iteration, I also switched from Python to Go. Since the project was growing, Go allows me to really easily create robust and maintainable code that I can still painlessly work with years after.
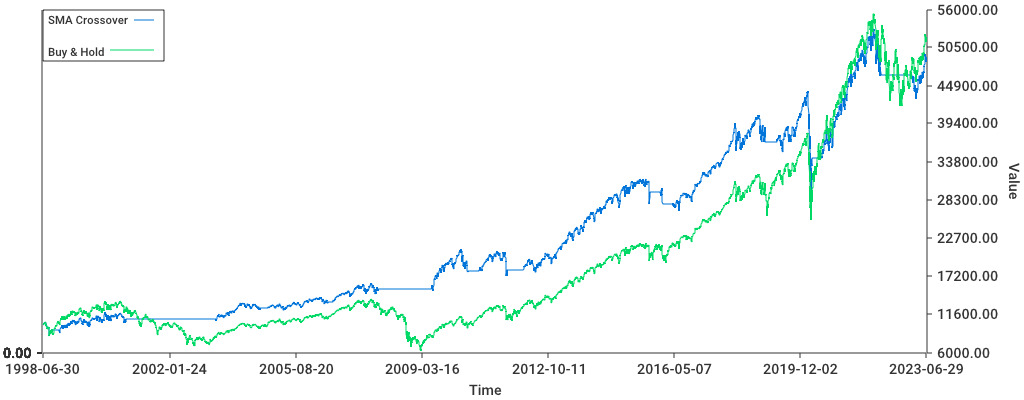
Edelfelt was able to read a list of transactions, turn this into a portfolio which is made up of different positions over time. From this portfolio, it generates a graph, but also output metrics such as the portfolio’s Sharpe ratio (basically the return/risk), compounded returns, total returns, and standard deviation.
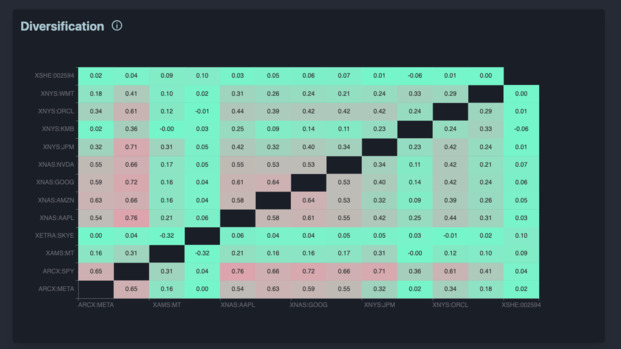
It could quickly be used to get a portfolio correlation matrix (showing if any 2 positions behave similarly), and weights vector (the % each position is taking in your portfolio). Lastly, you could use it to compare the portfolio to a benchmark (like the S&P500 or the 10-year US treasuries) and determine the excess returns from our strategies.
Alpha
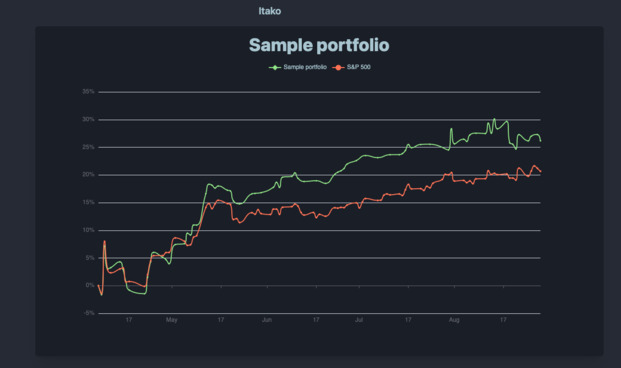
To make this useable by other people I decided to turn this into a web application, named Itako. I decided to re-use Mikochi’s stack, which is Go and Gin for the backend with a Preact frontend.
For a database, I decided to go with MySQL, because it is the only major database system that I have never seen catastrophically fail in production. The data visualization got a serious upgrade, thanks to Echarts (which is really awesome). I also decided to use DaisyUI to get some shiny looking CSS.
The backend used the previous code from Edelfelt as a module. This avoided me from having to re-develop everything from scratch. The main improvement is that now, we could cache stock prices in our database. I didn’t expect that to be complicated, sadly cache invalidation is a pain.
When I had a decent bunch of features to work with, I pushed the application to production and got around a dozen people to try it. People liked the visualizations, but also found a lot of bugs. Most were pretty minor UI issues, but some were more tricky. I hadn’t planned for some situations, like stock splits and delistings.
Beta
Aside from fixing the bugs noticed during the Alpha testing, the next step was to handle currency conversions. The aim of this was to let people have stocks from different countries in their portfolios.
Getting currencies data is relatively simple since there’s a lot of APIs offering that. However, it completely changes how investment returns are calculated. This led me to refactoring Itako’s business logic and completely getting rid of the dependency to Edelfelt.
I decided to go a bit more public about the project and made a Reddit post about it. Around 100 users decided to try Itako and I received plenty of feedback. The main point I learned from this was that I needed to focus on making the application a bit easier to use, and give more actionable data.
Release
To be honest, the project sat abandoned for a long while after this round of Beta testing. Nothing bad about it, I just really had to focus on shipping our Dice’n Goblins in time.
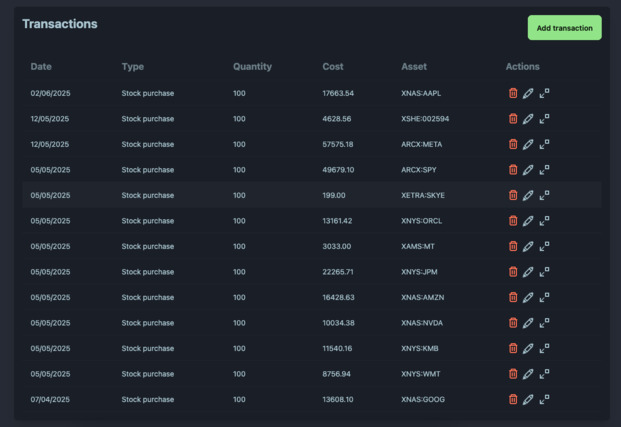
After the game release, I manage to find a bit of time to work on Itako again. I shipped quite a few improvements. Users can now use a simplified input form and abstract away handling cash. Those who do not like this can head to their settings and change it back.
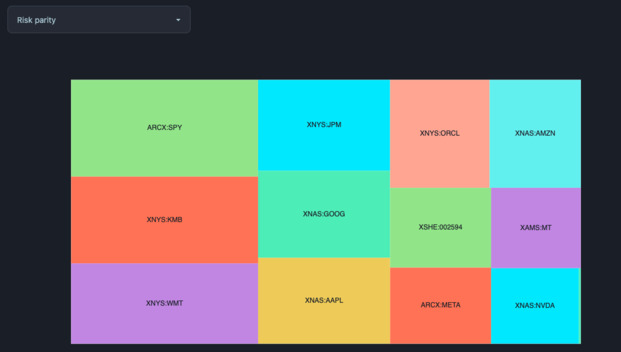
I also added a bit of polish, and added a much needed rebalancing feature. This feature shows you the output of different rebalancing strategies on your portfolio. Currently, it implements two very common strategies: equal weights and risk parity.
Quite recently, Itako removed its “Beta” badge. The project has most of the features I wanted to build when I created it. It feels weird saying it because I spent way too much time on this, but it is finished.
If you want to try it out, just head to itako.app. If you have questions, feedback, or encountered any issues while using Itako, don’t hesitate to email me about it.